
There are “Standard” Industry 4.0 Monitoring hardware / software and systems available in market. Mostly these focus on Machine / Equipment centric parameters like OEE, Downtime, Equipment Utilization, Energy Consumption and Productivity Dash-boarding. While Industry 4.0 sales pitches coax that all of this should be monitored for all your machines; a rebuttal comes from Industry …” If it is well known that we have been operating at 40% of our capacity what tangibles could be achieved by monitoring OEE?”
There are obviously diverse Business Scenarios and at least three kinds of Production and there may not be any “Standard Solution” that may fit all.
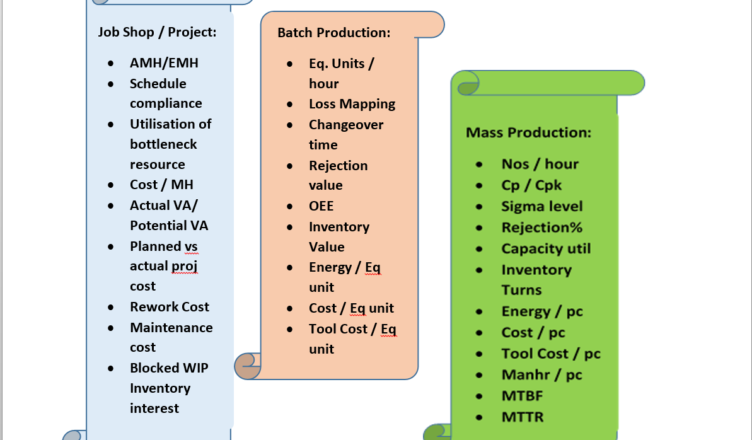
The green banner above for “Mass Production” typically lists parameters for SPM based single product automated lines or continuous Process Industry
The pink banner above for “Batch Production” typically lists parameters for production with GPMs with / without automation for a mix of standard product
The blue banner above for “Job Shop/ Project” typically lists parameters for non standard and non reptitive production / activities where Gantt Chart must be followed
Running through these banners some loud thoughts do come:
- There is nothing new in monitoring these parameters; Industry must have been already monitoring them wherever they found them important enough.
- Apart from making an automated dashboard; what else could be the value add through Industry 4.0?
Well, the answer is …”Grand Integration!” as illustrated through three example below:
Example 1: It is an established practice monitor vibrations and motor currents in CNC Machines for Predictive Maintenance; what can be done now is to record a “signature” pattern of vibration / currents for good mass production job. For every job manufactured subsequently the then achieved profile of vibration / currents gets compared with “signature”. Any abnormality owing to tool blunting etc could be caught at first appearance and the problem gets escalated.
Example 2: One could install energy meter to machines and monitor energy / pc in isolation but through Grand Integration it could get correlated with “signature” for mass production as example 1. For Job shop it could be used as indicator for type / extent of machining for the purpose of costing estimates.
Example 3: To follow Gantt Chart has been a standard practice but often its timely updating remains desirable. If jobs carry their I/d tag and machine read them and automatically update and escalate significant deviations from Gantt chart; it would yield direct results in terms of adhering to schedules, timelines, and cost overrun. Estimated Man / Machine Hours vs Actual Man / Machine Hours multiplied by respective hourly rates help keeping tab on Cost build-up for a Project.
It is always possible to have “Grand Integration’ including Sales / Market / Customer Data, Inventory, Financials in order to take the benefits to Business Level.
Industry 4.0 is about customizing and harnessing benefits of Data Correlation and this is where Industry must have their vision focused according to their context and Business Scenario.
AVINASH KHARE
IMTMA-PUNE